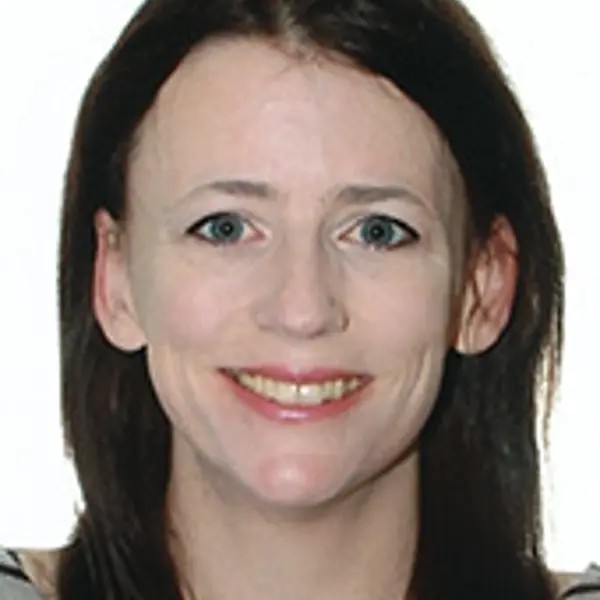
Beata Stahre Wästberg
I am an associate professor and senior researcher specializing in the interdisciplinary field of visualization in urban planning. My work explores how visualization can support analysis, communication, and dialogue within urban planning processes, with a research by design-approach. Early in my research career, I focused on visual realism in virtual environments, particularly the simulation and rendering of colour and light. In recent years, my research has shifted toward the visualization of invisible urban parameters, such as air quality, sound, and social impacts, within 3D-city models. My aim is to develop methods to facilitate understanding and communication around invisible phenomena which can be hard to grasp in urban development and decision making. I conduct interdisciplinary research in collaboration with academic colleagues from various fields, as well as partners from city authorities, government agencies, and the private sector. Since earning my PhD in 2009, I have worked as a researcher at the departments of Architecture (Chalmers), Applied IT (University of Gothenburg), and Computer Science and Engineering (Chalmers).

Showing 46 publications
MiljöVIS - Visualisering av osynliga miljömässiga och sociala faktorer i digitala modeller
Exploring perception of design choices for visualizing qualitative data
Towards Urban Digital Twins: A Workflow for Procedural Visualization Using Geospatial Data
Strategier för 3D-visualisering – Målkonflikter i infrastrukturprojekt
A Proposed Workflow for Conceptual Visualization Studies in Urban 3D-Models
Visualisation of traffic noise exposure and health impact in a 3D urban environment
Visual conflicts - Challenges in combining rich volumetric 3D-data in a realistic VR city model
Att synliggöra det osynliga - Kartläggning av representation av miljödata i digitala modeller
MiljöVis: Effektiv representation av miljödata i digitala modeller
Visualisering och auralisering av buller i stadsmiljö
An urban planning tool demonstrator with auralisation and visualisation of the sound environment
Visualizing environmental data for pedestrian comfort analysis in urban planning processes
User evaluation of a virtual colour laboratory as a tool for demonstrating colour appearance
How to Visualize the Invisible Simulating Air Pollution Dispersions in a 3D City Model
Visualisering inom Transportområdet – Kartläggning och utvärdering
A Virtual Colour Laboratory - Presentation and Invitation
The Influence of Visualization Technologies on Estimating Object Sizes and Colours
Sketching Techniques in Virtual Reality: Evaluation of Texturing in an Urban Planning Model
Developing Sketching Techniques in Virtual Reality for Better Understanding Urban Planning Processes
The influence of the applied technologies on estimating graphical representations
The Influence of Virtual Environment Technology on Estimating Object Sizes
How to Convert Reality into Virtual Reality: Exploring Colour Appearance in Digital Models
Colour Meaning in Different Settings: Example from the fine arts and experimental colour studies
The Effect of Culture on Colour Emotion and Preference
Towards perceptual colour for virtual environments
Experience of Light, Colour ans Space in Virtual Environments
Colour Emotions in Larger and Smaller Scale
The Arbitrary Road from Reality to Virtual Reality
Download publication list
You can download this list to your computer.
Filter and download publication list
As logged in user (Chalmers employee) you find more export functions in MyResearch.
You may also import these directly to Zotero or Mendeley by using a browser plugin. These are found herer:
Zotero Connector
Mendeley Web Importer
The service SwePub offers export of contents from Research in other formats, such as Harvard and Oxford in .RIS, BibTex and RefWorks format.
Showing 19 research projects
Visualization of cultural values in urban planning in a digital twin
FärgVis: Customized visualization for user needs with a focus on colour
Urban modelling and planning tool for energy and invisible environmental factors using AI methods
Climate adapted equal Gothenburg: The digital twin as a meeting place for discussion and co-creation
SolVis (SunWise) - concept for visualizing solar power and spreading knowledge on the subject
MiljöVis - Effective representation of environmental information in infrastructure models
SCENDA: Scenario visualization of environmental data in compact cities
How to visualize the invisible - Visualization of environmental factors in 3D city models
Visualization as an analysis tool for sustainable urban development
Visualization in the transport area - Inventory and evaluation
Architecture in the Making: Architecture as a Making Discipline and Material Practice
Sketching Techniques in Virtual Environments (STIVE)